


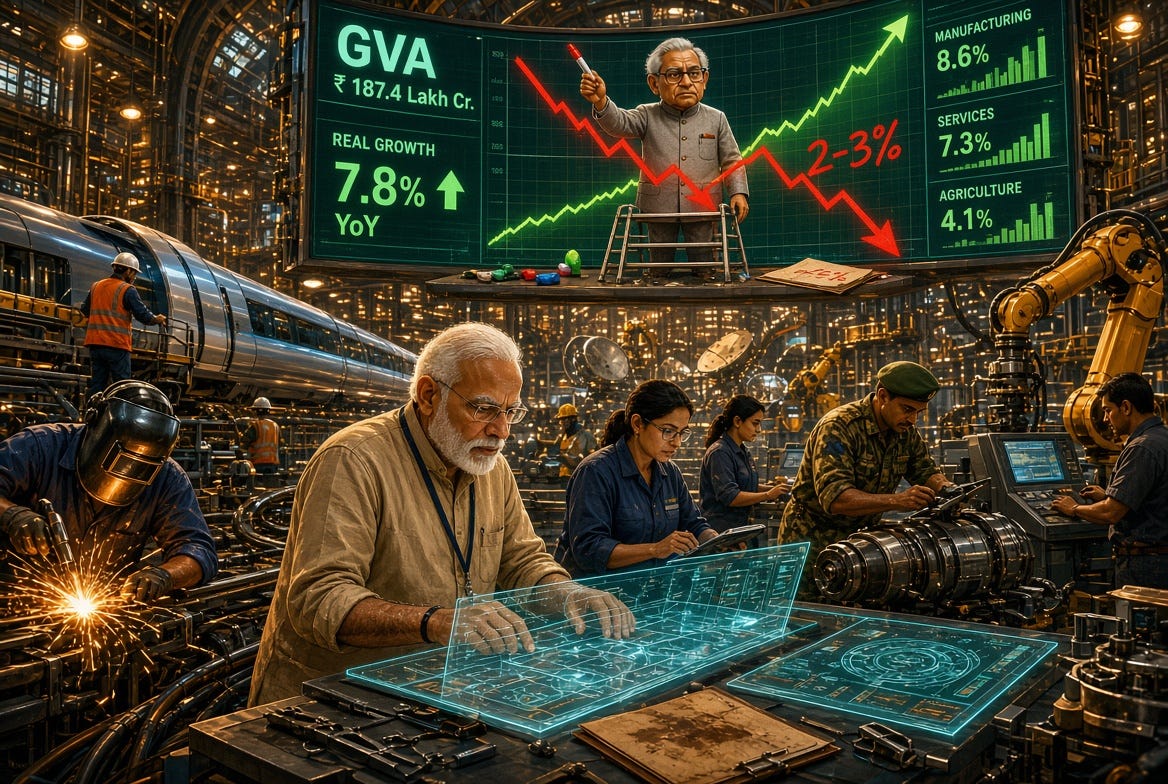
Some retired bureaucrats are dangerous. They air half-baked opinions, expose their own sloppiness, and leave the country wondering whether we are running on method or on Ram bharose. Subhash Garg is a recent example. He took a figure from the new GDP series, set it against an estimate drawn from the old series, and declared that Indian GDP growth was only 2–3 percent—not the 7.8 percent reported by the National Statistical Office. The usual anti-India chorus ran with the “fake GDP / manipulated GDP” line.
To the government’s credit, it put out heavy hitters to kill what was, in substance, a storm in a teacup. Those replies were right on the economics and poor as public explanation. It all sounded like technical mumbo-jumbo. That is not surprising. Garg’s comparison would not survive a first-year national-accounts class. It was economically illiterate. Specialists are often bad at translating that kind of error for normal people—especially when the error is being sold as a scandal rather than as a mistake.
Some of the people amplifying this know exactly what a series is. They know you cannot splice two kits and call the gap “true growth.” They still do it, because a viral number beats a correct one. That is not scrutiny. That is malice dressed as expertise.
So RightVIEWS has to step in to explain, in plain language:
How is GDP calculated?
What is a GDP series?
Why does the series change?
Why must we not compare numbers across series?
How is GDP calculated?
Think of the economy as a car and GDP growth as its speed. The speedometer is broken. The car is still moving. How do you estimate speed?
At first the road has telephone poles at fairly regular intervals. You count poles per minute and do the arithmetic. You get an approximate speed. Extra poles at junctions add error. That is a quarterly GDP estimate: a few timely indicators standing in for the whole economy.
Then the poles thin out. You have not stopped. You notice trees, spaced less evenly, and you start counting trees instead. Different marker, different error. That is a change of indicators and of what “the economy” is weighted to include.
You do not halt the car every kilometre with a tape measure. A full recount of every firm and household cannot be done every quarter. You live with a good-enough running estimate.
When you reach a town you learn you covered 240 km in four hours. Now you have a firmer check on average speed. That town is a detailed survey year—the year statisticians use to rebuild the map.
GDP works the same way. Early estimates count the current “poles”: industrial output, tax filings, vehicle registrations, crop data, corporate results. When the structure of activity changes, those poles no longer describe the road. Statisticians look for new markers. Every few years they stop at a town and redraw the map. You do not start counting bridge pillars after the bridge has ended and then announce that the car has stalled.
What is a GDP series?
A series is the whole kit used for a stretch of years:
a base year whose prices are the reference for “real” (inflation-stripped) growth
weights for sectors—how much manufacturing, services, construction, agriculture count
a method (including how prices are stripped out)
a set of data sources
India’s previous kit used 2011–12 as the base. The kit released in 2026 uses 2022–23. Same country, different measuring rod. That is a new series, not a new economy invented overnight—and not a licence to treat one rod’s reading as a confession that the other rod was a lie.
Why does the series change?
Because the road changed.
Over a decade, digital services, formalisation after GST, renewables, and consumption patterns all shifted. Relative prices shifted with them. An old base year keeps using yesterday’s prices and yesterday’s weights. Growth in new activity is under-counted; shrinking activity is over-weighted.
A rebase does four jobs at once:
Pick a reasonably normal year (not GST rollout, not peak Covid, not a rebound year) so the snapshot is not a freak stretch of road.
Re-weight sectors so the mix matches today’s economy.
Bring in better data—GST, producer prices, newer surveys of unincorporated firms, administrative files—instead of older proxies.
Improve method, including double deflation in manufacturing: output and inputs are deflated separately, which international manuals prefer when input and output prices diverge.
That is why even nominal GDP for a past quarter can move when the series changes. Coverage and classification changed, not only the price base.
Adding GST trails, PPI, and updated IIP is the equivalent of putting road signs and cameras on the highway. The car was always moving; you can now see it more clearly. Anyone who has compiled or supervised national accounts knows this. Pretending that a level from kit A minus a level from kit B is “the real growth rate” is not confusion. It is a stunt.
Why you must not compare numbers across series
This is the whole controversy in one sentence.
Poles-per-minute and trees-per-minute are both estimates of speed. They are not the same number. You cannot subtract one from the other and announce that the car slowed to a crawl.
A figure compiled with 2011–12 prices, 2011–12 weights, and the old deflators is not the twin of a figure compiled with 2022–23 prices, 2022–23 weights, new sources, and double deflation. Mixing them is counting bridge pillars after the bridge has ended.
Within a series, revisions are normal. First prints use thin indicators; later prints fold in company accounts and surveys. That is updating the same speedometer, not swapping it.
Across series, you wait for an official back series—the old years recast on the new method—before you talk about “what growth really was.” Until then, 7.8 percent and “2–3 percent from a hybrid calculation” are answers to different questions. Publishing the hybrid as an exposé is not analysis. It is a press release with a spreadsheet costume.
What this does not mean
It does not mean official statistics are sacred. Government numbers can and should be scrutinised. Deflators, informal-sector blow-ups, how far the new method is taken back, and whether the chosen “normal year” was the right one are legitimate questions. Debate them with the same series, the same definitions, and methods another statistician can replicate.
What is not legitimate is malicious splicing: take a new-series level, invent or borrow an old-series counterpart, ignore that the kits differ, and tour television as if you have unmasked the nation. People who spent careers near these tables know the rule. When they break it in public, the charitable reading is sloppiness. The less charitable reading is intent—to work up a storm, not to measure a car.
The useful habit is simple. Ask which series, which base year, and whether the comparison is inside one kit or across two. If it is across two, the speedometer analogy is enough: you changed what you count. You did not prove the engine died.
In Sum
Let there be lot of genuine criticism of government. Let it come through unfiltered and reach the very top so that the government may change its course.
But at the same time, let genuine praise for the government come through. And let us stop all the bullshit critiques AND unearned praise that only aim to misdirect the voters and sow discord.
Sources
PIB FAQ on the updated series (2 Sept 2026): https://static.pib.gov.in/WriteReadData/specificdocs/documents/2026/sep/doc_9782_20260902_20424501.pdf
Mint, base year and the data row: https://www.livemint.com/economy/gdp-data-row-what-is-the-base-year-how-is-it-revised-and-why-has-it-raised-a-political-storm-explained-11788497040848.html
Indian Express, PPI and double deflation: https://indianexpress.com/article/explained/explained-economics/why-gdp-data-revised-ppi-double-deflation-explained-10864088.html
Business Standard, methodology: https://www.business-standard.com/economy/news/explained-how-new-gdp-series-will-alter-growth-estimation-methodology-126022600891_1.html
World Economics on rebasing: https://www.worldeconomics.com/Concepts/BaseYears/
World Bank, why countries revise national accounts: https://datahelpdesk.worldbank.org/knowledgebase/articles/680284-why-do-countries-revise-their-national-accounts
All economics explanations have to start with an example of a car!